
The Moody chart or Moody diagram is a graph in non-dimensional form that relates the Darcy-Weisbach friction factor fD, Reynolds number Re, and relative roughness for fully developed flow in a circular pipe. The factor of proportionality used mostly for pressure loss calculations in pipelines is called the Moody friction factor and is determined from the Moody resistance diagram shown in Figure below. The friction factor is sometimes expressed in terms of the Fanning friction factor, which is one-fourth of the Moody friction factor. In some references the Moody friction factor is used, in others, the Fanning friction factor is used. Care must be exercised to avoid inadvertent use of the wrong friction factor.
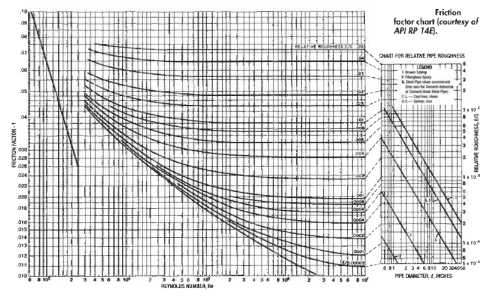
In general, the friction factor is a function of the Reynolds number, Re, and the relative roughness of the pipe, £/D. For Laminar flow, f is a function of only the Re:
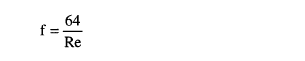
For turbulent flow, f is a function of both pipe roughness and the Reynolds number. At high values of Re, f is a function only of e/D.
Table shows the relative roughness for various types of new, clean pipe. These values should be increased by a factor of 2-4 to allow for age and use.

Reference: Design of oil handling systems & facilities, Surface Production Operations Volume-1
